Qualitative Research Design
1. Focus Group Discussiona. includes a limited number of respondents (6-10) from within your target market.
b. the main aim of the focus group is to find answers to the “why” “what” and “how” questions.
c. this method is very useful when it comes to market research on new products and testing new concepts.
d. can be done through the use of a survey.
2. Grounded Theorya. Purpose - theory development
Used in discovering what problems exist in a social scene & how persons handle them
Involves formulation, testing, & redevelopment of propositions until a theory is developed
b. Method - steps occur simultaneously; a constant comparative process.
• Data collection - interview, observation, record review, or combination
c. Analysis
Concept formation
Concept development - reduction; selective sampling of literature; selective sampling of subjects; the emergence of core concepts
Concept modification & integration
d. Outcomes - a theory supported by examples from data.
3. Phenomenologya. Purpose - to describe experiences as they are lived
examines the uniqueness of an individual's lived situations
each person has their own reality; reality is subjective
b. Research question development
What does the existence of feeling or experience indicate concerning the phenomenon to be explored?
What are necessary & sufficient constituents of feeling or experience?
What is the nature of the human being?
c. Method
No clearly defined steps to avoid limiting the creativity of the researcher
Sampling & data collection
Seek persons who understand study & are willing to express inner feelings & experiences
Describe experiences of the phenomenon
Write experiences of the phenomenon
Direct observation
Audio or videotape
d. Analysis
Classify & rank data sense of wholeness
Examine experiences beyond human awareness/or cannot be communicated
e. Outcomes
Findings described from the subject's point-of-view
Researcher identifies themes
A structural explanation of findings is developed
4. Discourse Analysis
5. Participant Observationa. Is a process of research that uses subjective methodologies to gather systematic information or data.
b. Deals with the 5 major sensory organs and their functioning – sight, smell, touch, taste, and hearing.
c. This does not involve measurements or numbers but instead characteristics.
6. Case Studya. Purpose - describe in-depth the experience of one person, family, group, community, or institution.
b. Method - direct observation and interaction with the subject
c. Analysis - synthesis of experience
d. Outcomes - in-depth description of the experience
7. Ethnographya. Purpose - describe and examine events of the past to understand the present and anticipate potential future effects.
b. Method
Formulate an idea - select a topic after reading related literature
Develop research questions
Develop an inventory of sources - archives, private libraries, papers
Clarify validity & reliability of data - primary sources, authenticity, biasesDevelop a research outline to organize the investigative process
Collect data
c. Analysis - synthesis of all data; accept & reject data; reconcile conflicting evidence.
d. Outcomes - select means of presentation — biography, chronology, issue paper.
ReferencesQUALITATIVE RESEARCH DESIGNS
https://www.umsl.edu/~lindquists/qualdsgn.html.
Probability Sampling Methods
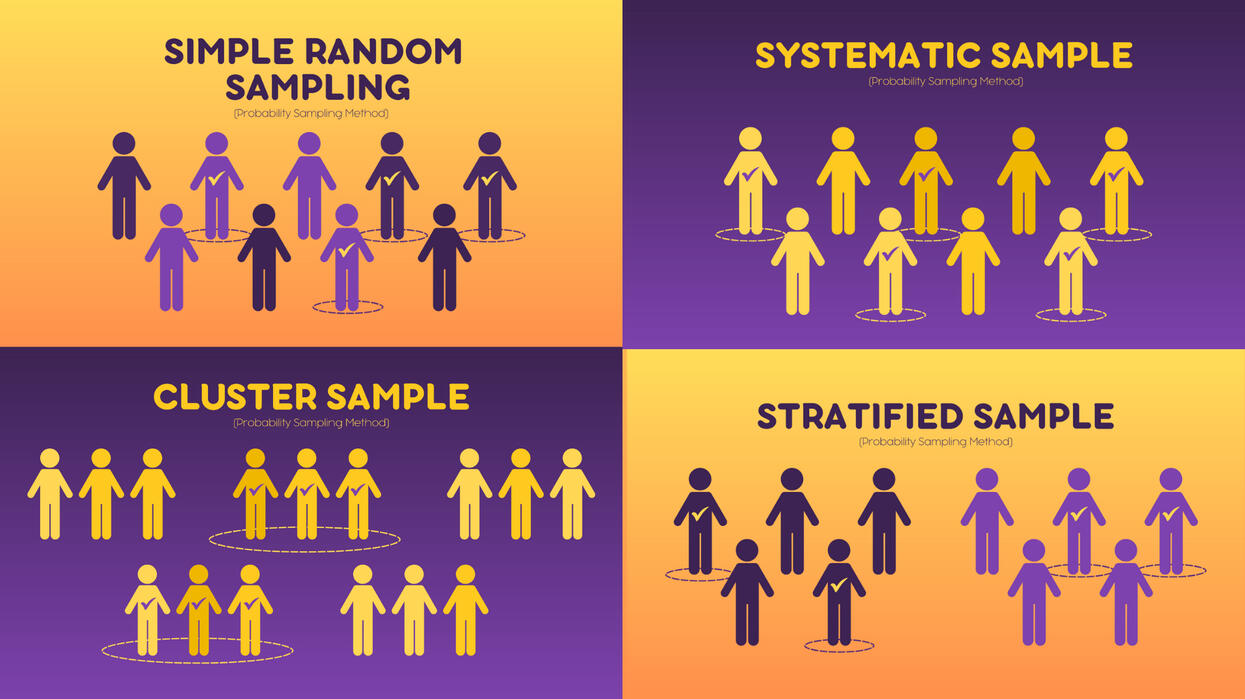
EXAMPLES:a. Simple Random Sampling: Using a random generator/ letting fate decide.You want to select a simple random sample of 1000 employees of a social media marketing company. You assign a number to every employee in the company database from 1 to 1000, and use a random number generator to select 100 numbers.
b. Systematic Sample: With order/system.All employees of the company are listed in alphabetical order. From the first 10 numbers, you randomly select a starting point: number 6. From number 6 onwards, every 10th person on the list is selected (6, 16, 26, 36, and so on), and you end up with a sample of 100 people.
c. Stratified Sample: Random Sampling in each group.The company has 800 female employees and 200 male employees. You want to ensure that the sample reflects the gender balance of the company, so you sort the population into two strata based on gender. Then you use random sampling on each group, selecting 80 women and 20 men, which gives you a representative sample of 100 people.
d. Cluster Sample: Random Sampling whole groups.The company has offices in 10 cities across the country (all with roughly the same number of employees in similar roles). You don’t have the capacity to travel to every office to collect your data, so you use random sampling to select 3 offices – these are your clusters.
Non-Probability Sampling Methods
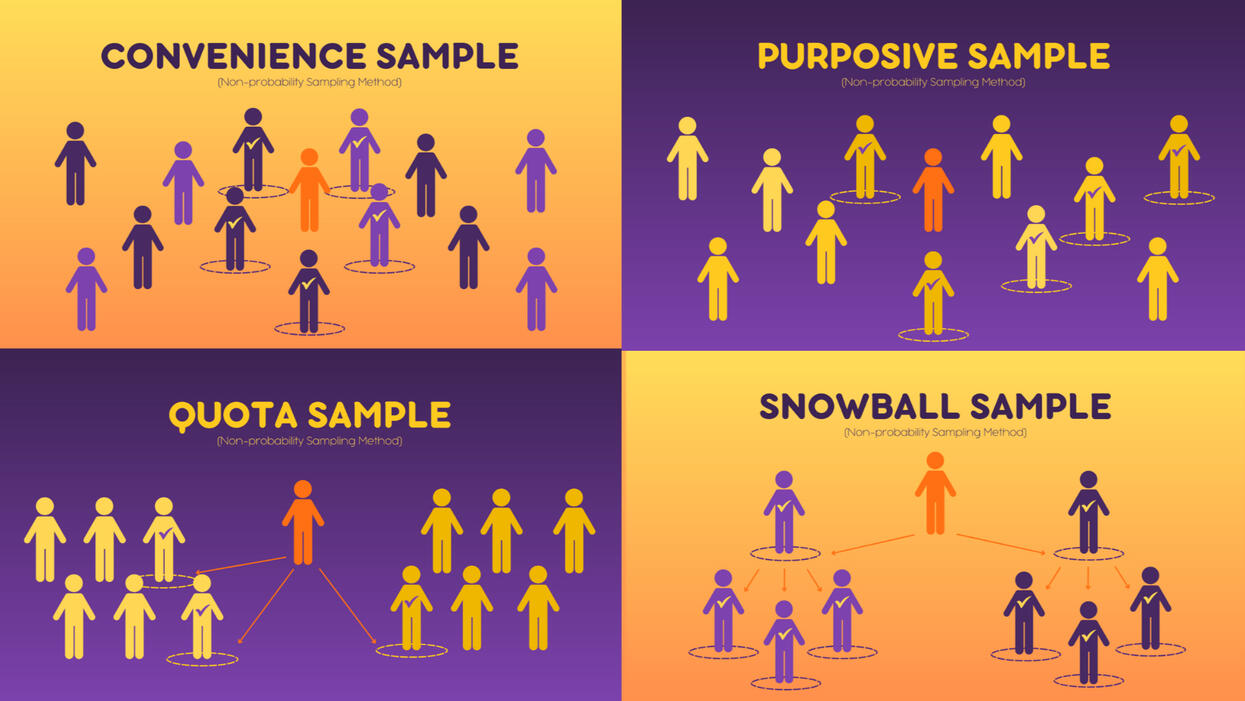
EXAMPLES:a. ==Convenience Sample: Selecting the most accessible. ==You are researching opinions about student support services in your university, so after each of your classes, you ask your fellow students to complete a survey on the topic. This is a convenient way to gather data, but as you only surveyed students taking the same classes as you at the same level, the sample is not representative of all the students at your university.
b. Purposive Sampling: Researchers select the sample most useful to the purposes of the research.You want to know more about the opinions and experiences of disabled students at your university, so you purposefully select a number of students with different support needs in order to gather a varied range of data on their experiences with student services.
c. Snowball Sample: Recruiting participants via other participants.You are researching experiences of homelessness in your city. Since there is no list of all homeless people in the city, probability sampling isn’t possible. You meet one person who agrees to participate in the research, and she puts you in contact with other homeless people that she knows in the area.
d. Quota Sample: Getting volunteers.You send out the survey to all students at your university and a lot of students decide to complete it. This can certainly give you some insight into the topic, but the people who responded are more likely to be those who have strong opinions about the student support services, so you can’t be sure that their opinions are representative of all students.
Statistical Analysis/Tests
I. TYPES1.Descriptive Statistical Analysis
- utilizing numbers to explain the characteristics of a data collection.
- makes analysis and understanding easier by using data visualization tools like tables, graphs, and charts.
2. Inferential Statistical Analysis
- utilized to generate conclusions or inferences about a wider population based on data from a sampled portion of that population.
3. Associational Statistical Analysis
- used by researchers to identify correlations and make predictions. They utilize it to discover connections between various factors.OTHER TYPES:- Predictive analysis
- Prescriptive analysis
- Exploratory data analysis
- Casual analysis
II. PROCESS1. Data collection
- gathering information from primary or secondary sources such surveys, online tests, financial records, and marketing automation tools.
2. Data organization
- also known as data cleaning,
- involves finding and eliminating redundant data and inconsistencies that can hinder you from doing an appropriate analysis.
3. Data presentation
- it involves setting up the data for simple analysis.
4. Data analysis
- involves employing statistical methods, such as inferential and associational statistical analysis.
5. Data interpretation
- the final step is data interpretation, which offers final findings about the goal of the analysis.\
III. Methods1. Mean
- you can calculate the mean, or average, by finding the sum of a list of numbers and then dividing the answer by the number of items in the list.Formula: Mean = Set of numbers / Number of items in the set2. Standard deviation
- an approach that shows how the data spreads around the mean.
- the data are widely scattered from the mean when the standard deviation is significant. The majority of the data are closer to the mean when the standard deviation is low.Formula: σ2 = Σ(x − μ)2/n3. Regression
- a method for establishing a connection between two independent and dependent variables.Formula: Y = a + b(x)4. Hypothesis testing
- used to test if a conclusion is valid for a specific data set by comparing the data against a certain assumption.
III. Editing and Analyzing SoftwareSPSS> means “Statistical Package for the Social Sciences” and was first launched in 1968. It is a software for editing and analyzing all sorts of data.
SIGNIFICANCE TESTS:• One-Way ANOVA Calculator for Independent Measures
• One-Way ANOVA Calculator for Repeated Measures
• Binomial Test Calculator
• Chi-Square Calculator for 2 x 2 Contingency Table
• Chi-Square Calculator for 5 x 5 (or less) Contingency Table
• Chi-Square Calculator for Goodness of Fit
• Fisher Exact Test Calculator for 2 x 2 Contingency Table
• The Friedman Test for Repeated Measures
• The Kolmogorov-Smirnov Test of Normality
• Kruskal-Wallis Test Calculator for Independent Measures
• Levene's Test of Homogeneity of Variance Calculator
• Mann-Whitney U Test Calculator
• Sign Test Calculator
• Standard Error Calculator
• T-Test Calculator for 2 Independent Means
• T-Test Calculator for 2 Dependent Means
• T-Test Calculator for a Single Sample
• Wilcoxon Signed-Rank Test Calculator
• Z Score Calculator for a Single Raw Value
• Z-Test Calculator for a Single Sample
• Z-Test Calculator for 2 Population ProportionsPREDICTION:• Linear Regression Calculator
• Multiple Regression CalculatorTESTS OF CORRELATION:• Pearson Correlation Coefficient Calculator
• Phi Coefficient Calculator
• Point-Biserial Correlation Coefficient Calculator
• Spearman's Rho (Correlation) CalculatorP - VALUES:• P-value from Z score.
• P-value from t score.
• P-value from chi-square score.
• P-value from Fratio score.
• P-value from Pearson (r) score.
• Critical Values Calculator.
• Tukey Q calculator.BAYES THEOREM:• Quick Bayes Theorem CalculatorEFFECT SIZE:• Effect Size CalculatorsCONFIDENCE INTERVALS:• An Independent Samples Confidence Interval Calculator
• A Single-Sample Confidence Interval Calculator (Z Statistic)
• A Single Sample Confidence Interval Calculator (T Statistic)BIOSTATISTICS:• Relative Risk and Odds Ratio Calculator
• Number Needed To Treat CalculatorUTILITIES:• Sample Size Calculator
• Random Number Generator
• A Baby Growth Percentile Calculator
• A Normal Distribution Generator
• A Rank Order Calculator
• Highest Common Factor Calculator
• Number Formatters and Transformers
• Number Formatter: European Format to North American Format
• Number Formatter: North American Format to European Format
• Running Pace Calculator